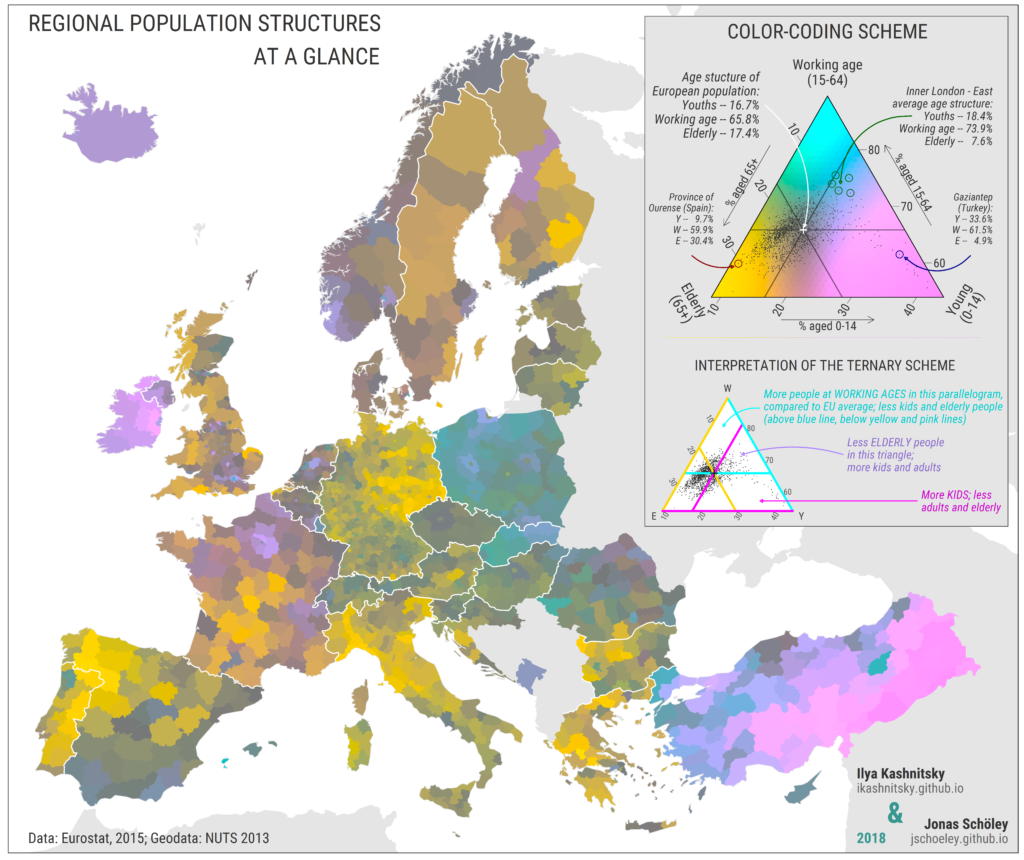
” Each NUTS-3 region’s population composition is uniquely colour coded. Colours show direction and magnitude of deviations from the center point, which represents the average age-composition of European population and has a dark grey colouring. Hue component of a colour encodes the direction of deviation: towards yellow – more elderly population (65+); cyan – more people at working ages (15-64); magenta – more kids (0-14). Chroma and lightness components signify the distance from the center ranging from desaturated and dark colours near the center to vivid and bright colours at the corners. The smaller schematic ternary plot at the bottom of the legend explains how to interpret the six different regions in the ternary colour key “
Vous retrouverez ici des articles portant sur des sujets divers et variés, ayant pour dénominateur commun la géographie, la cartographie et la géomatique. Pour plus d’infos sur mon travail : https://tonyhauck.com